- Flex PCB Blog
- PCB Assembly Blog
- FPC Research Blog
- Preparation of FPC based on ultrasonic spraying method_4_Experimental Results
- Preparation of FPC based on ultrasonic spraying method_3_Experimental Procedure
- Preparation of FPC based on ultrasonic spraying method_2_Experimental Platform and Principle
- Preparation of FPC based on ultrasonic spraying method_1_abstract
- Research on Layout Design Method of Ultra-thin FPC_4_Analysis of Layout Design Methods
- Research on Layout Design Method of Ultra-thin FPC_3_Analysis of Layout Design Methods
- Research on Layout Design Method of Ultra-thin FPC_2_Analysis of Layout Design Methods
- Research on Layout Design Method of Ultra-thin FPC_1_introduction
- Research progress on polyimide FPC_2_the field of FPC
- Research progress on polyimide FPC_1_Introduction
- Analysis of Vibration Characteristics of FPCBs _4_Summary
- Analysis of Vibration Characteristics of FPCBs _3_Finite Element Analysis
- Analysis of Vibration Characteristics of FPCBs _2_Theory of Vibration Analysis
- Analysis of Vibration Characteristics of FPCBs Under Random Vibration_1_Introduction
- Design Methods for FPCBs_5_Practical Application
- Design Methods for FPCBs_4_Electrical Circuit Design and Examples
- Design Methods for FPCBs_3_Structure Design Method and Examples
- Design Methods for FPCBs_2_Component Selection Methodology and Examples.
- Research on Design Methods for FPCBs
- Application of MPW technique for FPCBs _4_Summary
- Application of MPW technique for FPCBs_3_Experimental results
- Application of MPW technique for FPCBs_2_Experimental setup
- Application of MPW technique for FPCBs_1_Principle of MPW
- Application of FPCB in PC motherboards_4_ Results and discussion
- Application of FPCB in PC motherboards_3_ Numerical analysis
- Application of FPCB in PC_2_ Experimentation
- Application of FPCB in PC motherboards
- A Bus Planning Algorithm for FPC Design _4_Experimental result
- A Bus Planning Algorithm for FPC Design _3_Proposed Algorithm
- A Bus Planning Algorithm for FPC Design _2_Preliminaries
- A Bus Planning Algorithm for FPC Design _1_Introduction
Application of flexible printed circuit board (FPCB) in personal computer motherboards
Focusing on mechanical performance_2_ Experimentation
2.Experimentation
2.1. FPCB material testing
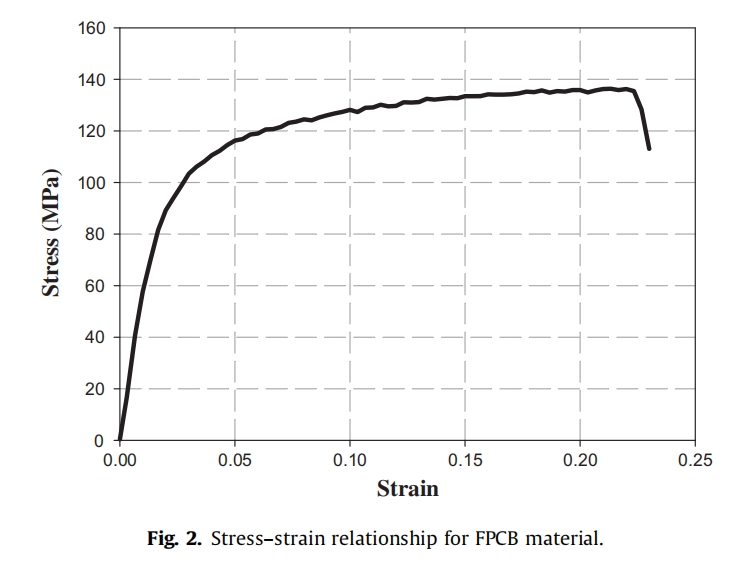
Material testing was carried out on a ready-to-use FPCB, which was purchased from PCB Universe located in the United States. This FPCB had an overall thickness of 0.1 mm and is single-sided, consisting of single polyimide and single copper layers. As shown in Fig. 1, this test was conducted according to ASTM D638, which is a standard test method for the tensile properties of plastics, using an INSTRON table-mounted Universal Testing Machine at a testing speed of 50 mm/min. From the test, the resultant stress–strain relationship of the material is shown in Fig. 2. The effective elastic modulus of FPCB was found to be 5.24 GPa in the linear elastic region, and its yield strength was estimated to be approximately 80 MPa.This effective modulus value was found to be close to that reported in a previous work.

2.2. test vehicle
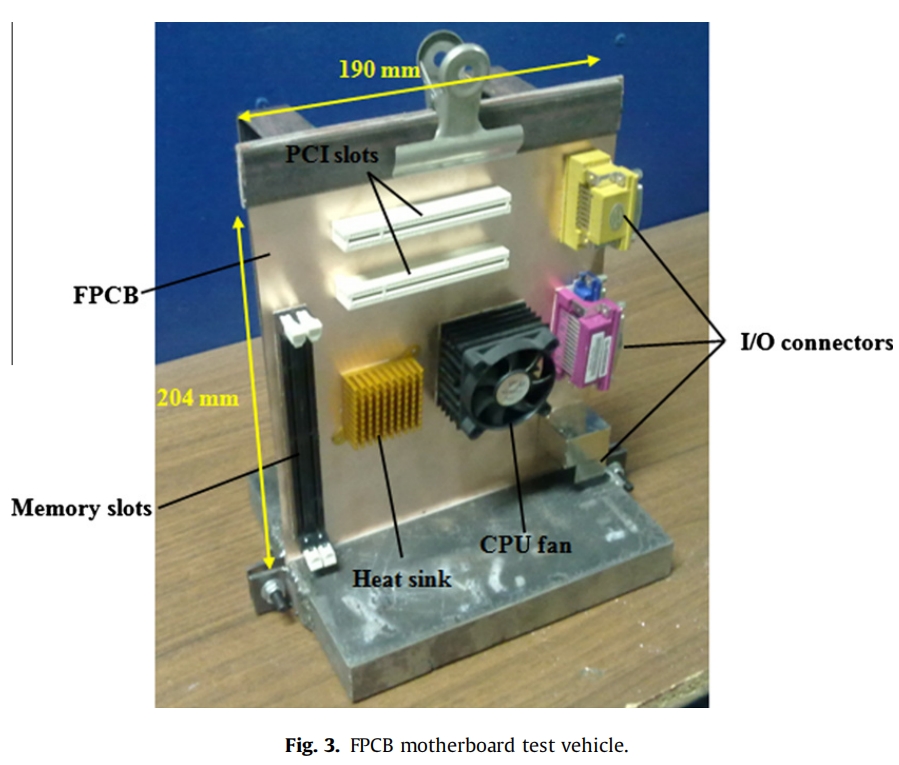
Primarily, typical electronic components were removed from old PC motherboards using a desoldering process. Only the identified mechanically significant components were considered for analysis in the present study because of the development difficulty; for example, memory connector slots, PCI connector slots, I/O connectors, heat sink, and CPU fan. The less mechanically relevant components, such as capacitors, resistors, and integrated packages, were ignored in the current study. Each chosen compo- nent was individually attached onto the FPCB using strong adhesive, and subsequently, the resulting FPCB motherboard was clamped vertically, as shown in Fig. 3. This prototype was believed to represent well a realistic motherboard mechanically.

2.3. Experimental setup
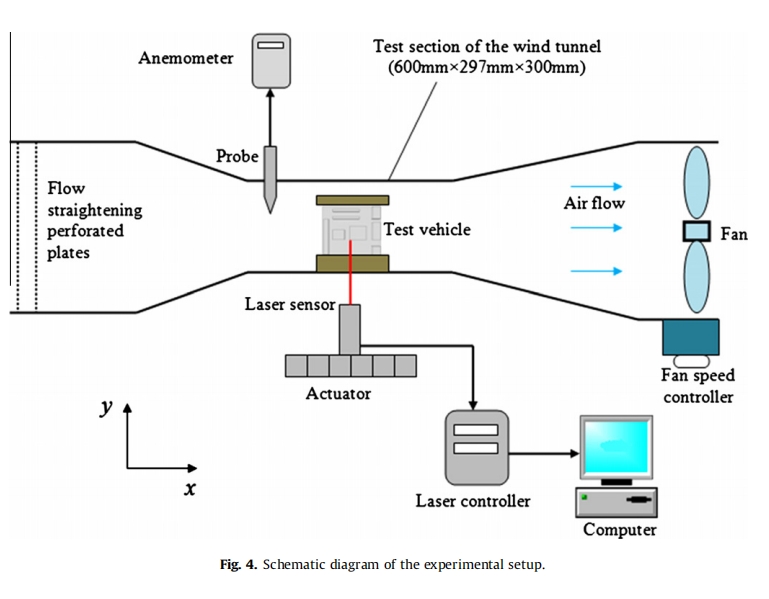
In the experiment, the test vehicle was tested in a wind tunnel, which had an adjustable fan speed, as shown in Fig. 4. For data measurement, the real-time flow-induced deflection of the FPCB motherboard was captured using a KEYENCE LK-G152 laser sensor connected to a controller, which had an accuracy of 0.001mm.The position of the laser sensor can be easily manipu- lated using the linked actuator. In addition, the captured data were also displayed and stored in the computer for further anal-ysis. To measure the air flow velocity, an anemometer with a probe, which had an accuracy of 0.01 m/s, was also incorporated in the setup. The experiment was conducted under few flow velocities by manipulating the fan speed controller. At each velocity, the test was run a few times, and the accompanying uncertainties were determined using the statistical t-distribution given by Eq.


where is the uncertainty value, tis the value that depends on the level of significance and degree of freedom, S is the standard devi- ation, and n is the number of tests. In the present study, by applying a 90% confidence interval, the t value was found to be 2.13.


